Mathematics
Grade Levels: 6th Grade, 7th Grade, 8th Grade, 9th Grade, 10th Grade, 11th Grade, 12th Grade,
Topics: AlgebraCoordinate SystemsFunctions and RelationsPatterns
Common Core State Standard: F-IF.8b,
Knowledge and Skills:
· Can plot a point in a two-dimensional coordinate system, given the coordinates, or determine the coordinates of a given point
· Can extrapolate a graph when a pattern exists
· Can relate aspects of a graphical model to the real world situation which is being modeled
· Can use a functional relationship to predict the value of one variable when the other is known
Lesson:
Procedure: This activity is best done by students working individually or in teams of two.
Once students have graphed the data, ask them to explain the meaning of the graph (the larger the size of the rock, the less the number of those rocks that would be found).
For beginning students, you may wish only to distribute the first page of the handout. For more advanced students, distribute both pages.
The data is fairly closely matched by the function,
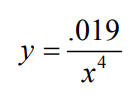
This equation gives 3,040 rocks of size 4 to 5 centimeters, and 130 rocks of size 10 to 11 centimeters.
Rocks
Investigation
In order to design a rover that can travel on the surface of Mars, you need to have a good idea of how big the rocks are.
Suppose that the table below represents data collected from previous missions to Mars. The tables tells us that, in one 10 meter by 10 meter area, there were 1440 rocks that ranged in size from 5 to 6 centimeters; 780 pebbles, with sizes of 6 to 7 centimeters; and so on.
| size of rocks (centimeters) | Number of rocks in an area 10 m x 10 m |
| 5-6 | 1440 |
| 6-7 | 780 |
| 7-8 | 460 |
| 8-9 | 290 |
| 9-10 | 190 |
Can you use this data to predict how many rocks would be from 10 to 11 centimeters, or 4 to 5 centimeters?
Here is one approach:
1. Graph the above data. For the “size” variable, use the lower value in the range (your first data point would be (5,1440), second data point would be (6,780), etc.
2. See if there is a pattern to the data. Extend the pattern to estimate the number of rocks you would find between 4 and 5 centimeters across.
_________ rocks
3. Extend the pattern in the other direction to estimate the number of rocks you would find that are between 10 and 11 centimeters across.
_________ rocks
If you know enough algebra, you can find a more exact answer by using equations, as follows:
1. Which of the following functions do you think might fit the graph of the data? (Hint: Two of the four might fit.)
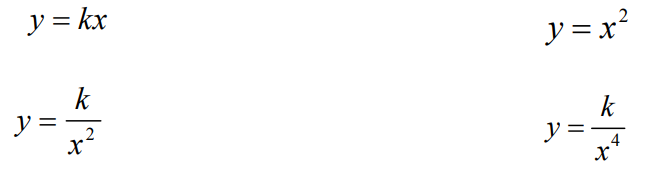
2. For one of the functions you picked, use one of the data points from the table as your x and y values, to find the value of k. Then try another data point. Do you get nearly the same value of k? Test all of the data points, and compare the values of k.
3. If those values are close to each other, then
a. take their average
b. graph the function with that value of k
c. compare that graph to the first graph you made (of the actual data).
4. If those values of k are not close to each other, try another function from the four above, and repeat step 2.
5. What equation do you think is the best fit for the data?
______________________________