Mathematics
Science
Grade Levels: 4th Grade, 5th Grade, 6th Grade, 7th Grade,
Topics: PatternsStatisticsWeather and Climate
Common Core State Standard: 2.MD.10, 5.OA.3, 6.SP.4, 6.SP.5a, 7.SP.1,
Concepts:
Seasonal temperature changes
Knowledge and Skills:Recognizing and describing patterns
Download the Teacher Guide PDFLesson:
Procedure: Distribute the handout, and graph paper.
As needed, help the students to set up their graphs. For younger students, you may wish to do this as a class activity.
These characteristics can be brought out in discussion:
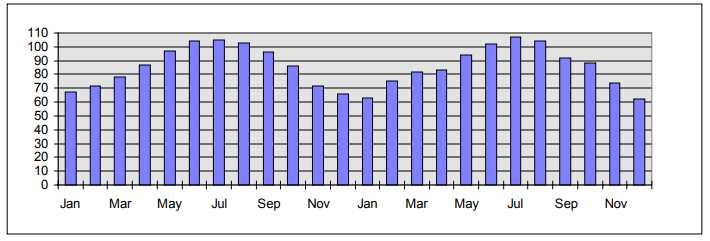
• The graph shows a wave pattern which repeats itself every 12 months.
• The hottest month is July for both years, the coldest is January.
• The temperatures range from a little above 60 degrees to around 105.
Weather Patterns
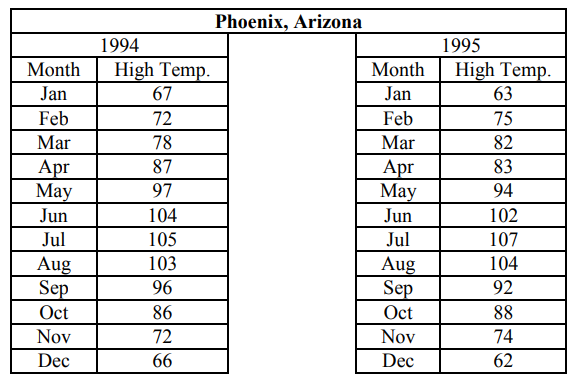
The chart below shows the high temperature in Phoenix, Arizona every month for two years.
Graph the temperatures on a sheet of graph paper. Do you see a pattern? Describe it below.
The pattern: __________________________________________
____________________________________________________
____________________________________________________
____________________________________________________
____________________________________________________