Mathematics
Problem Solving
Science
Grade Levels: 5th Grade, 6th Grade, 7th Grade, 8th Grade,
Topics: Reasoning and CommunicationStatisticsVariablesUse a Chart or TableThe Nature of Science and Technology
Common Core State Standard: 1.MD.4, 3.MD.3, 4.MD.2, 6.SP.1,
Concepts:
Mathematics:
· Variable
Knowledge and Skills:Mathematics:
· Can apply the strategy “use a chart or table”
· Can explain the reasoning used to solve a problem
· Can represent and interpret numerical data in chart and graph form
Science:
· Can create a chart for the collection of experimental results
· Can graphically analyze the relationship between variables in an investigation
· Can present experimental results clearly in written form and/or graphical form
(for each team):
· one cake pan
· one plate
· one bowl
· one glass or cup
· ten cotton-swab tips
Lesson:
Procedure: This activity is best done with students working in teams of three or four.
Arrange the students into teams and distribute the handout. Discuss the game and the assignment, ensuring that students understand how the game is to be played and the purpose of their experiment.
Discuss the concept of variable and ask students to explain what the variables are for this experiment (distance between player and dishware, and game score). Have the students explain how they will measure and keep track of the two variables as the members of their teams play the games. Instruct each team to create a chart to record their data, and examine the charts.
Students will need to work out some of the details of the experiment, such as how to measure the distance between dishes and player, and what distances to use. It is not necessary that all teams do the experiment in exactly the same way, and it is a good idea to let the teams work out answers to these questions on their own as much as possible.
As students carry out the experiment, circulate, observe, and help as needed.
Once a team has gathered its data from the experiment, ask them to work out how they could organize that data so it is easy to grasp. They might put the data in a chart which shows the scores for each player at each distance, and/or put it into graph form (make a scatterplot with scores on the vertical axis and distances on the horizontal axis).
Once students have organized their data, have them examine it and decide what distance would be best to use in the actual game. Each team should present and justify their decision, either in a written or oral report.
Complete the lesson by reviewing the concept of variable and the variables that were used in this activity. Discuss also the fact that one of the variables (the score) seems to depend on the other variable (distance)—this will give students an informal introduction to the concept of a function.
Tip Toss
For the upcoming school carnival, you have been assigned the job of running the “tip toss”, a game in which players throw cotton-swab tips at an arrangement of dishware.
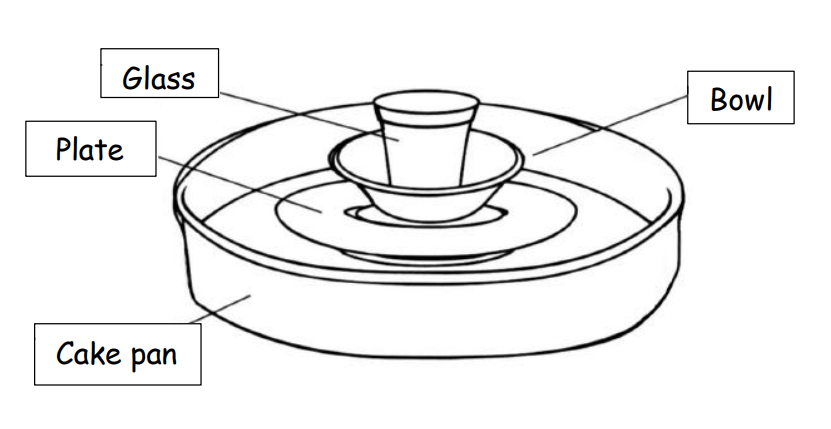
Players get 5 throws, and must earn 50 points to win. Scoring is as follows:
Glass: 25 points
Bowl: 15 points
Plate: 10 points
Cake pan: 5 points
In order to set up the game, you need to decide how far away from the dishes the player must stand. You want to make it difficult to win, but not impossible.
To help you decide, do this experiment:
1. Work with a team of two or three others.
2. Each member of the team plays several games of tip toss at various distances from the dishes. Record their score at each distance.
3. What are the two variables of your experiment? Organize your data.
4. Based on your data, decide on the distance you would use, and explain how you made your decision in a written or oral report.