Mathematics
Grade Levels: 4th Grade, 5th Grade, 6th Grade, 7th Grade, 8th Grade,
Topics: ProbabilityStatistics
Common Core State Standard: 6.SP.2, 6.SP.4, 7.SP.1, 7.SP.2, 7.SP.6,
Concepts:
· Equilateral
· Isosceles
· Vertex
· Probability
· Sample size
· Frequency distribution graph
· Can describe a polyhedron in terms of “faces”, “edges” and “vertices”.
· Can represent and interpret numerical data in chart and graph form.
· Can create a frequency distribution graph
· Understands the importance of “sample size” as it relates to experimental accuracy.
(for each team):
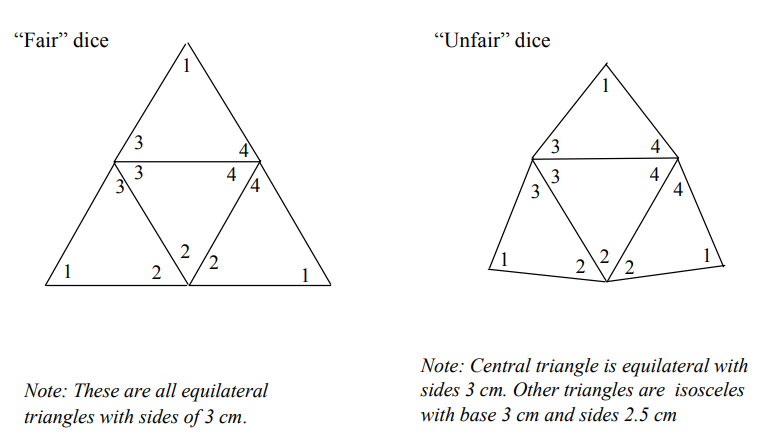
· One pair of “fair” tetradice and one pair of “unfair” tetradice (see diagrams below)
Lesson:
Procedure: Arrange students into teams of two, and distribute the handout and one pair of fair tetradice to each team..
Discuss the shapes of the tetradice, and review related concepts in geometry (polyhedron, equilateral and isosceles triangles, vertex).
Review with the class the instructions for the activity, and have all teams carry out that activity with the fair tetradice. (If students are unfamiliar with how to make a frequency distribution graph, you will need to explain this to them.)
Circulate as students carry out the activity. Ensure that they are all recording the data in their charts in a clear and neat manner, and that they are making the frequency distribution graphs correctly.
Once students have completed the experiment with the fair tetradice, discuss the results. You may wish to point out that the frequency distribution graphs for the first ten rolls are not necessarily similar among the teams, but the frequency distribution graphs for all forty rolls are more similar. This presents an opportunity to discuss the concept of sample size and how it relates to the accuracy of a probability experiment.
Now hand out the unfair dice, and have students repeat the experiment.
Pattern for tetradice
Use index card stock if possible. Cut and fold along sides of inner triangle. Tape edges together with strips of identical size (and also put strips of tape along the folds to maintain weight balance.)
Tetradice
Get a pair of tetradice from your teacher and look at them carefully. Write down all of the things you observe about the shapes.
When you roll one of the tetradice, your score is the number that is written near the vertex that is sticking up. When you roll two tetradice, your score is the sum of the points on each of them.
Here’s an experiment to learn more about tetradice:
1. Roll your two tetradice together, ten times. For each roll, add the numbers at the top of each of the tetradice to get the total score. Keep track of the scores on a chart.
2. After ten times, make a frequency distribution graph of the scores. Which scores occur most often?
3. Roll your tetradice ten more times, and record the data in your chart.
4. Make another frequency distribution graph showing the results for all 20 rolls of the dice. Compare it to the one you made before. What do you notice?
5. Roll your tetradice ten more times, and record the data in your chart.
6. Make another frequency distribution graph showing the results for all 30 rolls of the dice. Compare it to the one you made before. What do you notice?
7. Roll your tetradice ten more times, and record the data in your chart.
8. Make another frequency distribution graph showing the results for all 40 rolls of the dice. Compare it to the one you made before. What do you notice?
Now get another pair of tetradice from your teacher, and repeat the experiment.
Did you get the same results?
Compare the two pairs of tetradice, and compare their frequency distributions.
What do you observe?