Mathematics
Grade Levels: 6th Grade, 7th Grade, 8th Grade, 9th Grade, 10th Grade, 11th Grade, 12th Grade,
Topics: AlgebraQuadratic Equations and Functions
Common Core State Standard: A-CED.1, A-REI.10, F-IF.1, F-IF.4,
Concepts:
• Quadratic
Knowledge and Skills:• Can determine the equation of a quadratic function that closely matches a set of points
• Given the equation of a specific quadratic relation, can rapidly sketch its graph
Lesson:
Procedure: This activity is best done by students working individually or in teams of two.
Distribute the handout and discuss the task. Make sure that students understand the two variables involved (speed of the wind, and the pressure against the side of the building). Discuss how those variables might be related (as speed increases, pressure would increase) and other factors that might affect that relationship (shape of the building, direction of the wind).
To find the values of a, b, and c, students will need to choose three data points. Once they have done this once, you may wish to have them determine a, b, and c for different data points and see how closely those values match, and then perhaps use the averages of the values of a, b, and c as their proposed function.
In wrapping up, you may wish to discuss why the pressures seem lower for the East wind.
SkyHighScrapers
To: Structural Engineering Team #5
From: R. Shreve, Chief Architect
We just got back the data from wind tunnel testing for our proposed “doubledecker sports arena” (see diagram 1).
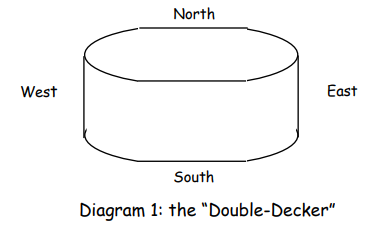
Table 1 shows the pressure when the wind blows from the east.
Table 2 shows the pressure when the wind blows from the north.
The pressure, of course, increases with higher wind speed. Theoretically, we expect that the relationship is quadratic: p = av2 + bv + c
Can you help us out?
1) For table 1, graph the data, then find the values of a, b, and c for the quadratic equation that gives a good fit to the data in the table. Draw the graph of your equation on top of the graph of the original data, so I can see how well it matches. Use that equation to give us an estimate for the pressure for wind speeds for 5 mph and 100 mph.
2) Do the same thing for table 2.
Thanks.
Rich
Table 1: East Wind
| Wind Speed (miles per hour) | Pressure (pounds of force per square foot) |
| 10 | 1 |
| 20 | 1.6 |
| 30 | 2.8 |
| 40 | 4.3 |
| 50 | 5.9 |
| 60 | 8.1 |
| 70 | 11 |
| 80 | 14 |
Table 2: North Wind
| Wind Speed (miles per hour) | Pressure (pounds of force per square foot) |
| 10 | 2 |
| 20 | 3 |
| 30 | 4.5 |
| 40 | 6.5 |
| 50 | 10 |
| 60 | 13 |
| 70 | 16.5 |
| 80 | 22 |