Mathematics
Grade Levels: 6th Grade, 7th Grade, 8th Grade, 9th Grade, 10th Grade, 11th Grade, 12th Grade,
Topics: Coordinate SystemsLinear Equations and FunctionsPatterns, Relations and Functions
Common Core State Standard: 5.G.2, 6.NS.8, 7.RP.2a, 7.RP.2b,
Knowledge and Skills:
· Can plot a point in a two-dimensional coordinate system, given the coordinates, or determine the coordinates of a given point
· Can relate aspects of a graphical model to the real world situation which is being modeled
· Understands that linear functions are characterized by the fact that the ratio of change in independent variable to change in dependent variable is constant
· Can determine the equation of a linear function that closely matches a set of points (optional)
Lesson:
Procedure: The activity is best done in teams of two to four students.
The activity provides an opportunity to explore the behavior of a linear and non-linear function.
Arrange the class in teams and, as the first task, have each team read the memo from Robert Mesta and discuss it amongst themselves to ensure they understand it. As this is occurring, circulate and help as needed. Then discuss the memo as a class and make sure all students understand what is being asked for. In particular you will want to discuss several examples of “productivity” to be sure that the concept is understood.
Next, have each team work out answers to the questions presented in the memo. Each team should prepare a written report on their results.
As a wrap-up, have each team present its answers to one of more of the questions asked, and discuss as a class. Guide students to the realization that the straight-line nature of the first graph is a consequence of the fact that the amount of change in the dependent variable is the same each year.
With more advanced students you may wish to have them work out the equation of the linear function related to question #1, and with even more advanced students you may wish to have them work out the equation of the exponential function related to questions #2 and #3.
Answers
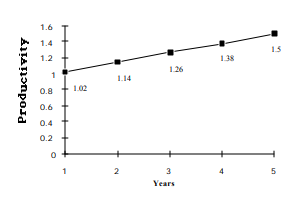
1. Productivity needs to increase by 0.12 per year.
There are several possible approaches:
•Trial and error: Try an increase of, say, 0.1 each year. After 5 years the value would
be 1.4 (0.9 + 0.1 + 0.1 + 0.1 + 0.1 + 0.1). Since this value is not high enough, try a
slightly larger increase (say, 0.11), and so on.
•Calculation: The total increase is from 0.9 to 1.5, which is equal to 0.6. This occurs
over 5 years, so the yearly increase is 0.6/5 = 0.12.
•Graphing: Make a graph with two points (0, 0.9) and (5, 1.5). Connect the points
with a straight line and read the intermediate values off the graph.
2a. 110% of 0.9 = 0.99
2b. 110% 0f 0.99 = 1.09
2c. 110% of 1.09 = 1.20
2d. 110% 0f 1.20 = 1.32
2e. 110% of 1.32 = 1.45
3. A percentage increase of 110% is not quite enough to reach the target of 1.5 at year 5.
Increase the percentage slightly to 111%.
year 1 = 112% of 0.9 = 1.00
year 2 = 112% of 1.00 = 1.11
year 3 = 112% of 1.11 = 1.23
year 4 = 112% of 1.23 = 1.37
year 5 = 112% of 1.37 = 1.52
To get an answer closer to 1.5 would require choosing a percentage such as 110.7%.
4. Increasing by the same amount annually gives a straight-line graph; increasing by the same amount percentage annually gives a straight-line graph a graph whose slope gradually increases with time.
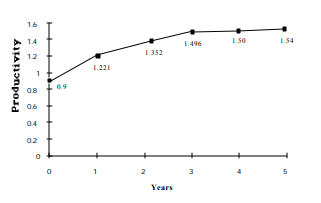
5. Accept any graph that is initially steep and then levels off, such as the one below
Project
To: Assistant Wildlife Biologists
From: Robert Mesta/United States Fish and Wildlife Service
Subject: Setting intermediate goals
I am currently working on a recovery plan for a bald eagle population in the Northwest. I need your help in developing the best plan.
This plan is based on increasing the productivity of the population. (Productivity is the ratio of the number of eagles that are born and leave the nest each season, divided by the number of nests in an area. For example, if you have 8 nests, and in one year there are 6 baby eagles born which survive long enough to leave the nest and fly on their own, the productivity for that year is 6/8, or 0.75 in decimal form.)
We have decided to set the following long-range goal: increase productivity from 0.9 to 1.5 over the next 5 years. We are more likely to reach our 5-year goal if we set annual targets as well, so we need to determine what those annual targets will be.
There are several ways to approach this problem. Your answers to the following questions will help me choose an option.
1. Suppose that productivity increased by the same amount each year. Draw a graph that shows what the productivity would be after one year, two years, three years, four years, and five years.
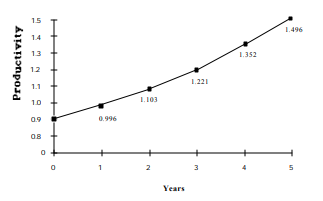
2. Suppose that productivity increased by the same percentage each year. First, please work out what would happen if the percentage increased at a rate of 110% each year.
a) Productivity at end of year 1 = 110% of 0.9 =
b) Productivity at end of year 2 = 110% of productivity at end of year 1 =
c) Productivity at end of year 3 = 110% of productivity at end of year 2 =
d) Productivity at end of year 4 = 110% of productivity at end of year 3 =
e) Productivity at end of year 5 = 110% of productivity at end of year 4 =
3. An increase of 110% each year does not achieve our goal of 1.5 by the end of the fifth year. What annual percentage increase would reach that goal? Make a graph based on your calculations.
4. Compare the graphs you made for questions 1 and 3.
5. Realistically, productivity will probably increase most in the first few years right after we introduce the recovery plan. In later years, increases in productivity will be smaller and may even level off. Draw a graph of
productivity over five years that shows that type of situation.