Mathematics
Grade Levels: 6th Grade, 7th Grade, 8th Grade, 9th Grade, 10th Grade, 11th Grade, 12th Grade,
Topics: AlgebraCoordinate SystemsLinear Equations and Functions
Common Core State Standard: 6.EE.9, 8.EE.5, 8.EE.7b, 8.F.3, 8.SP.1, 8.SP.2, 8.SP.3, A-CED.2, A-REI.3, A-REI.10, S-ID.6,
Knowledge and Skills:
· Can plot a point in a two-dimensional coordinate system, given the coordinates, or determine the coordinates of a given point
· Can extrapolate a graph when a pattern exists
· Can use a functional relationship to predict the value of one variable when the other is known
· Can determine the equation of a linear function that closely matches a set of points
· Can solve a one-variable linear equation
Lesson:
Procedure: This activity is best done by students individually or in teams of two.
When they graph the data, they will need to determine what the variables are (year, amount of rice produced), and which is independent (year) and which is dependent (rice)
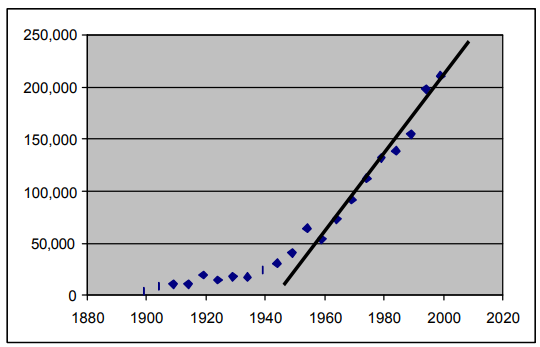
The line above represents a good fit to the given data in the domain of 1959 to 1999; its equation is:
y = 3670x – 7,130,810
Solving this equation for x = 2004 gives 223,870 hundreds of pounds of rice.
Solving for x = 2005 gives 242,200 hundreds of pounds of rice.
Solving for y = 250,000 gives the year 2011.
Rice Production
Investigation
The table below shows how much rice has produced in the United States, every 5th year for the past 100 years.
| Year | Hundreds of pounds of rice produced |
| 1899 | 4,029 |
| 1904 | 8,647 |
| 1909 | 10,614 |
| 1914 | 10,565 |
| 1919 | 19,310 |
| 1924 | 14,689 |
| 1929 | 17,790 |
| 1934 | 17,571 |
| 1939 | 24,328 |
| 1944 | 30,974 |
| 1949 | 40,769 |
| 1959 | 53,647 |
| 1954 | 64,193 |
| 1964 | 73,166 |
| 1969 | 91,904 |
| 1974 | 112,386 |
| 1979 | 131,947 |
| 1984 | 138,810 |
| 1989 | 154,487 |
| 1994 | 197,779 |
| 1999 | 210,458 |
Can you use this data to predict how much rice might be produced in the years 2004 and 2009? Can you predict in what year rice production will reach 250,000?
Here is one approach:
1. Graph the above data.
2. See if there is a pattern to the data. Extend the pattern to estimate the number of pounds of rice that would be produced in the year 2004.
_________ hundreds of pounds
3. Extend the pattern further to estimate the number of pounds of rice that would be produced in the year 2009.
_________ hundreds of pounds
4. Extend the pattern further to find the year for which the amount of rice produced is 250,000.
_________
If you know enough algebra, you can find a more exact answer by using equations, as follows:
1. Look at the data on the graph from 1959 to 1999. These points nearly all line up on a straight line.
2. Draw in a line that comes closest to the data points, and find its equation.
3. Use that equation to predict the production of rice in 2004 and 2009.
2004: __________
2009: __________
4. Use that equation to find in which year you would expect rice production to be 250,000 hundreds of pounds.
__________