Mathematics
Problem Solving
Grade Levels: 4th Grade, 5th Grade, 6th Grade, 7th Grade,
Topics: ArithmeticStatisticsCoordinate SystemsLook for a Pattern
Common Core State Standard: 6.SP.1, 6.SP.2, 6.SP.4,
Concepts:
· Variable
Knowledge and Skills:· Can measure lengths
· Can apply the strategy “look for a pattern”
· Can represent numerical data in chart and graph form
· Can plot a point in a two-dimensional coordinate system, given the coordinates, or determine the coordinates of a given point
· a centimeter ruler
· ten pea pods of varying lengths
· graph paper (1 cm grid)
Lesson:
Procedure: Students can do this project individually or in teams of two.
Distribute the handout and have students read the instructions (to themselves). Ask students to explain what they are going to be doing in the activity and what question they are going to try to answer (whether or not you can predict the number of peas in a pod from its length).
Discuss what the variables are in this activity (number of peas, length of the pod). Ensure that students understand why these are variables.
Have the students do step 1 of the activity. Circulate to ensure that they are following the instructions correctly, measuring correctly, recording their data, and working well in teams.
Each team must get your approval for having correctly completed step 1 before doing step 2.
Pause once all teams have completed step 2. Ask students to show their results so far and to explain whether or not they see any patterns in the data. Have three or four teams present their data in this fashion, then begin the class on step 3 (making the graphs).
Circulate as graphs are made to be sure they are being done correctly. As each team completes their graph, verify that it correctly represents their data, and ask them to go on to step 4, discussing their graph as a team.
When teams have completed step 4, have them present their data and conclusions to the class. Be sure that they give an answer to the question being investigated, and can explain the reasoning behind that answer.
Wrap up the activity by discussing these points (or having students answer these questions in their journals):
1) What variables were involved in the activity (number of peas and lengths of pods)?
2) Did the graphs make it easier to see the patterns?
3) Was this a good way to try to answer the question?
Peas in a Pod
Peas grow inside little bags on the pea plant, called “pods”.
Some pods have more peas than others. Can you tell how many peas will be in a pod by measuring its length? Do this experiment to find out.
1) Get 10 pods. For each one, measure the length of the pod, then open it and count the peas. Record all of your information and organize the information in a table.
2) Make a graph that shows the data in your table. The graph should look like this:
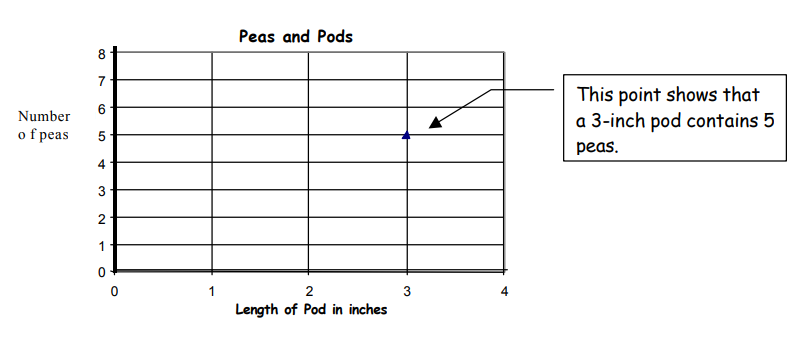
3) Study your graph. Can you predict how many peas will be in a pod if you know its length? Explain your answer.