Mathematics
Grade Levels: 6th Grade, 7th Grade, 8th Grade,
Topics: Percents
Common Core State Standard: 6.RP.3c, 7.RP.3, F-IF.8b,
Concepts:
• Percent
Knowledge and Skills:• Can calculate percent of increase of a quantity
Download the Teacher Guide PDFLesson:
Procedure: Distribute the handout and ensure that students understand what the data and graphs represent.
If students have already studied the calculation of percent increase, arrange the class in small mixed-ability groups of 3-4 students to work on the problem.
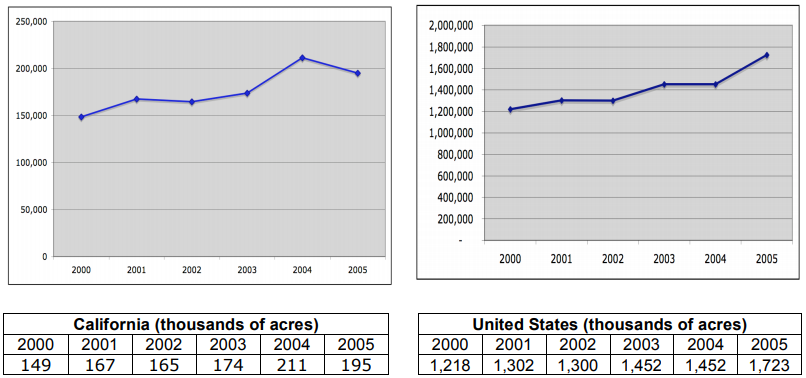
If you wish to use this activity to teach students how to determine percent increase, have students first subtract to find the total amount of acreage increase in California and the U.S. from 2000 to 2006 (an additional 46,000 acres for California; 505,000 acres for the U.S.) Discuss whether or not that is a fair comparison of the rate of growth, and explain that another way of thinking about the rate is how much the acreage increased each year as a percent of the year before. Show students how to compute the percent increase for the year 2001 over the year 2000, and have them repeat the procedure to compute the percent increase for each subsequent year. The results should be as follows:
| Year | Percent increase over previous year in California | Percent increase over previous year in U.S. |
| 2001 | 13% | 7% |
| 2002 | -2% | 0% |
| 2003 | 6% | 12% |
| 2004 | 22% | 0% |
| 2005 | -8% | 19% |
As to the second question, there are different ways of determining which growth was faster. One method would be to average the percent increases each year; the average growth for California would be 6.2% each year, and for the U.S. would be 7.6% each year. Another method would be to simply compute the percent of growth over the entire period of time from 2000 to 2006: for California this is 31%, and for the U.S. it is 41%. Either way, the U.S. rate of growth would be determined to be higher than the rate for California.
The third question assesses how well students understand what the data represents and the implications of the calculations they’ve learned to perform. If the data for year 2005 is dropped, that would eliminate California’s lowest year of growth (-8%) and the U.S.’s highest year (19%) and is therefore quite likely to change the answer for question #2.
Organic Acres
This data indicates the number of acres of organic crops in California and the United States, from the year 2000 through 2005.
1) Find the percent of increase for each year from 2001 through 2005 for both California and the U.S.
| Year | Percent increase over previous year in California | Percent increase over previous year in U.S. |
| 2001 | ||
| 2002 | ||
| 2003 | ||
| 2004 | ||
| 2005 |
2) For which set of data, California or the U.S., is the number of acres of organic crops growing faster? Explain how you arrived at your answer.
3) Suppose that you only considered the years from 2000 to 2004 in your calculations. Just by looking at the graphs and the answers to question #1, do you think that might change your answer to question #2? Explain.