Mathematics
Grade Levels: 7th Grade, 8th Grade, 9th Grade,
Topics: AlgebraCoordinate SystemsFunctions and RelationsPatterns
Common Core State Standard: 8.EE.5, S-ID.7,
Concepts:
· Function
Knowledge and Skills:· Can plot a point in a two-dimensional coordinate system, given the coordinates, or determine the coordinates of a given point
· Can relate aspects of a graphical model to the real world situation which is being modeled
Lesson:
Procedure: This project should be done by students individually or teams of two.
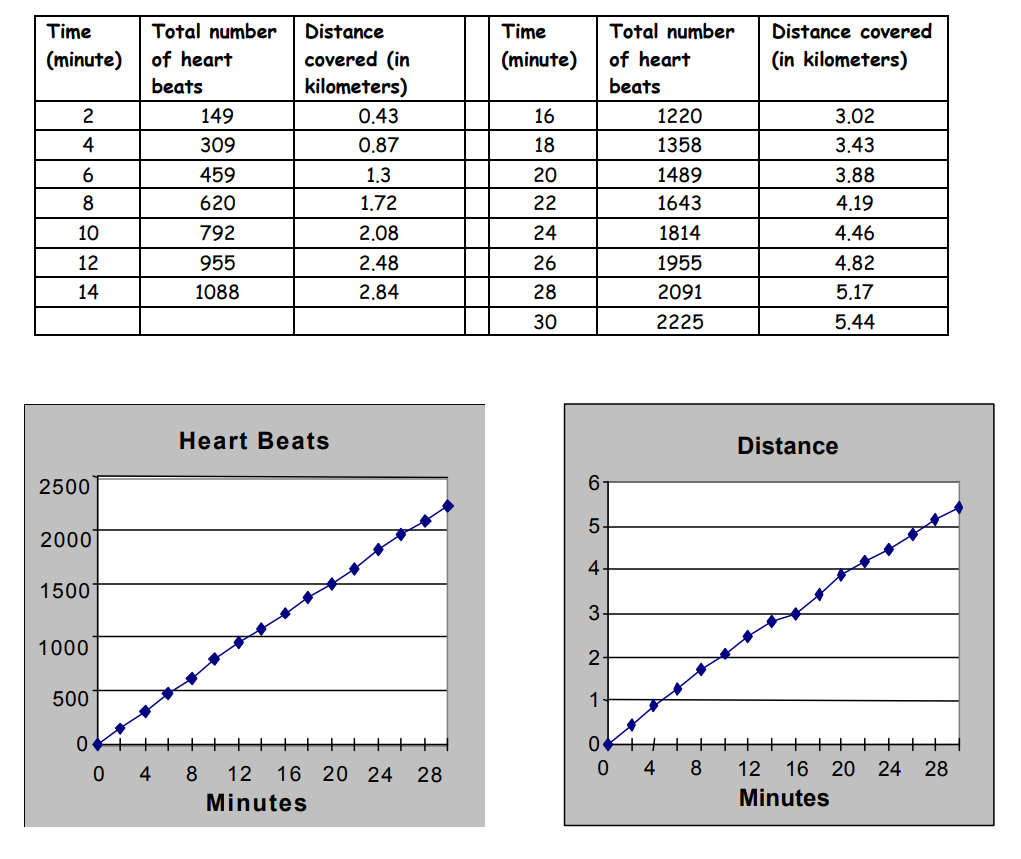
Distribute the handout and ensure that the students understand what the data represents. Read question 1, and discuss how to compute the heart rate (by subtracting the beginning heart beat count from the ending heart beat count for each two minute interval and dividing by the length of the interval–2 minutes). Have them begin with question 1, and circulate as they work on this and assist as needed.
In most cases, and especially with less advanced students, it is preferable to stop after most or all students have completed question 1 and discuss the results.
Discuss how both the “heartbeats” and “heart rate” graphs demonstrate the idea of a function.
You may wish to make a large copy of the heartbeats and heart rate graphs so that students can compare them. Help them to see the correspondence between the points on this graph (lower slope of “heart beats” graph corresponds to lower heart rate on “heart rate” graph).
Once all students understand the results for question 1, ask them to continue and work out the answers to the rest of the questions.
Students should find that Ingrid was apparently climbing a hill at minutes 6 to 10 and again at minutes 20 to 24, was probably going downhill at minutes 12 to 14 and again at 16 to 20, and took it easy at around minute 16 and again at the very end of the run. The terrain might have been flat at first, then she went up and down a hill, and then down into and back up out of a valley.
National Games Committee
To: Assistant Coaches
From: Head Coach
Re: Ingrid’s Cross Country Practice
Below is the data we collected on Ingrid’s last run. Please check it out as follows:
1. Graph her heart rate against time throughout the run. At what points was her heart rate highest? Lowest?
2. Graph her speed versus time. When was she traveling faster? When was she traveling more slowly?
3. When going uphill, you would expect her speed to decrease while heart rate increases. Can you spot where she might have been going uphill? Can you find where she was going downhill?
4. Was there anyplace on the run where it looks like she took it easy?
5. Do you think you could try sketching the slope of the terrain throughout this run, based on this data? (I want to make sure that she really followed the route we planned for her.)
Please get this back to me right away, so I can plan her next run.
Bjorn