
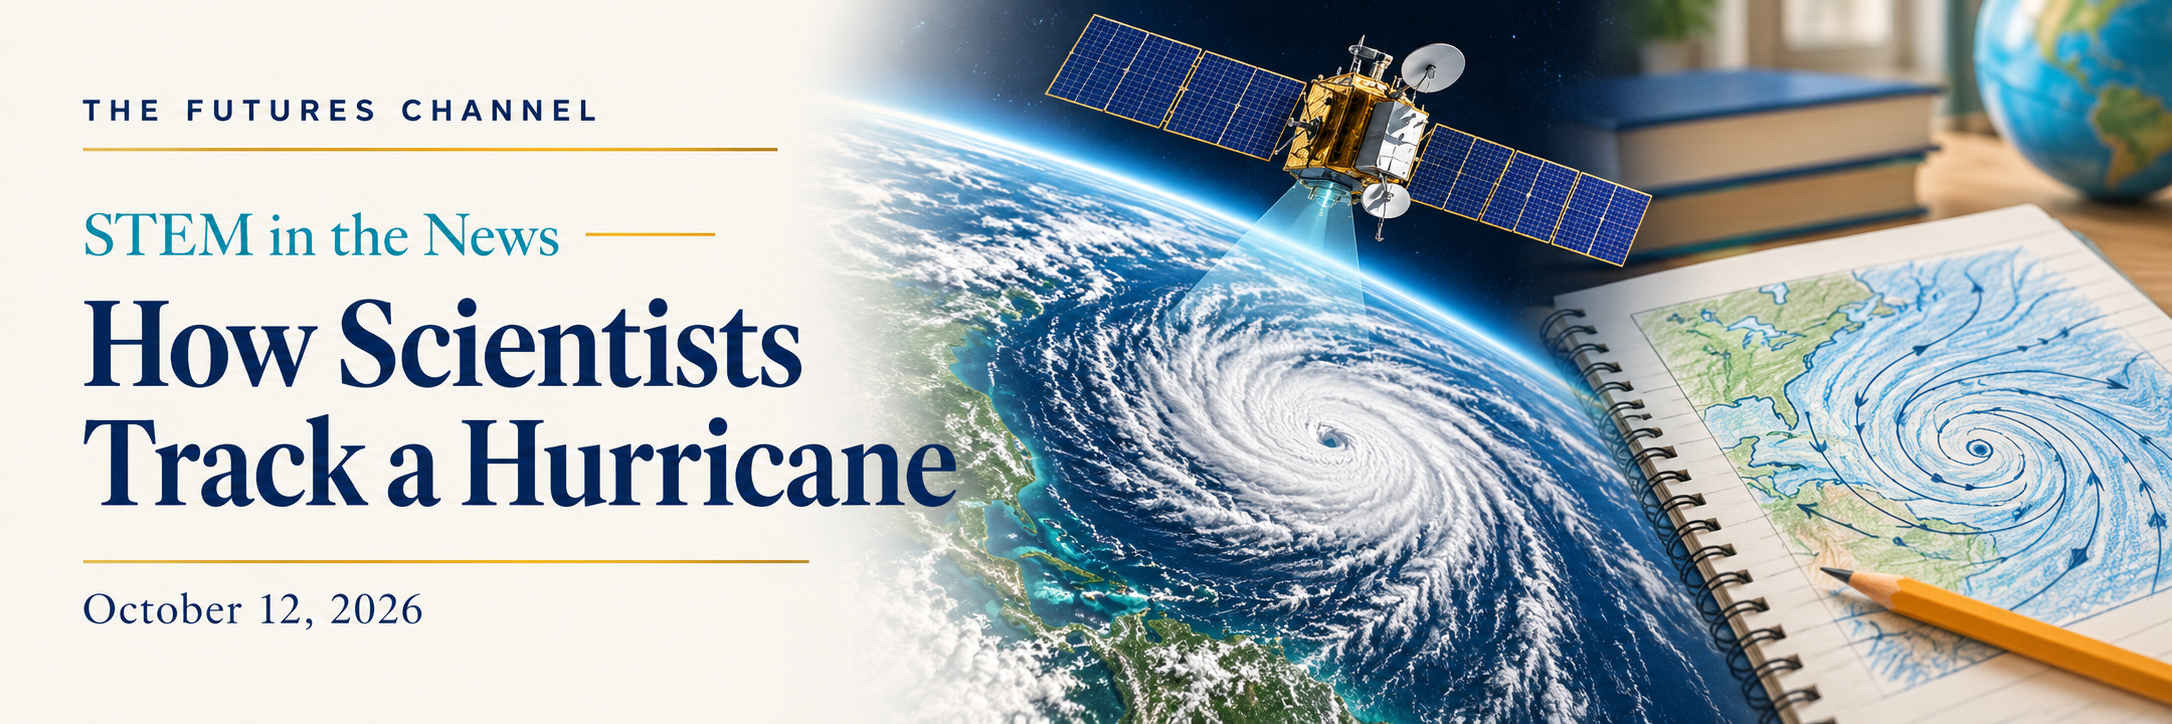
A weather map is more than a picture. It represents measurements that scientists use to understand what is happening—and to estimate what may happen next.
On October 8, NOAA published a satellite view of Hurricane Isaias developing over the Gulf. The imagery follows the storm during October 7–8. NOAA also reported that instruments dropped from Hurricane Hunter aircraft helped establish when Isaias strengthened from a tropical storm into a hurricane. Together, these observations offer students a timely example of science at work: gathering evidence, interpreting changes, and communicating findings.
The Futures Channel’s Understanding Hurricanes introduces scientist Kevin Petty and his work to improve predictions of hurricane intensity and duration. The 2-minute, 41-second video is listed for grades 5–10. It provides background for exploring the October report; it is an earlier educational resource, rather than coverage of this particular storm.
Teachers can extend the connection with Auditioning Now, a lesson that asks pairs of students to prepare a three-minute weather presentation using maps. The assignment emphasizes explaining conditions clearly and using evidence to make short-term predictions.
Classroom use: Show the video, then display NOAA’s dated satellite sequence. Ask students to identify what they can observe directly and what would require additional measurements. Have pairs prepare a brief weather report based on the October 8 source. Each presentation should identify its date, describe the observations, and explain one question scientists were trying to answer. Students should label any forecast from that report as a forecast made at the time.
For younger students, provide sentence starters such as “The image shows…” and “To learn more, scientists measured….” Older students can compare the roles of satellite imagery and aircraft instruments, then explain why several kinds of evidence can improve a report.
This activity connects meteorology with a skill useful across STEM: making a clear statement that the available evidence supports.
Discussion question: What can a satellite image tell us about a hurricane, and what additional measurements would help us understand its strength?